Design verification uses Category, MTTFD, DC, and CCF to verify that the proposed system achieves the required Performance Level.
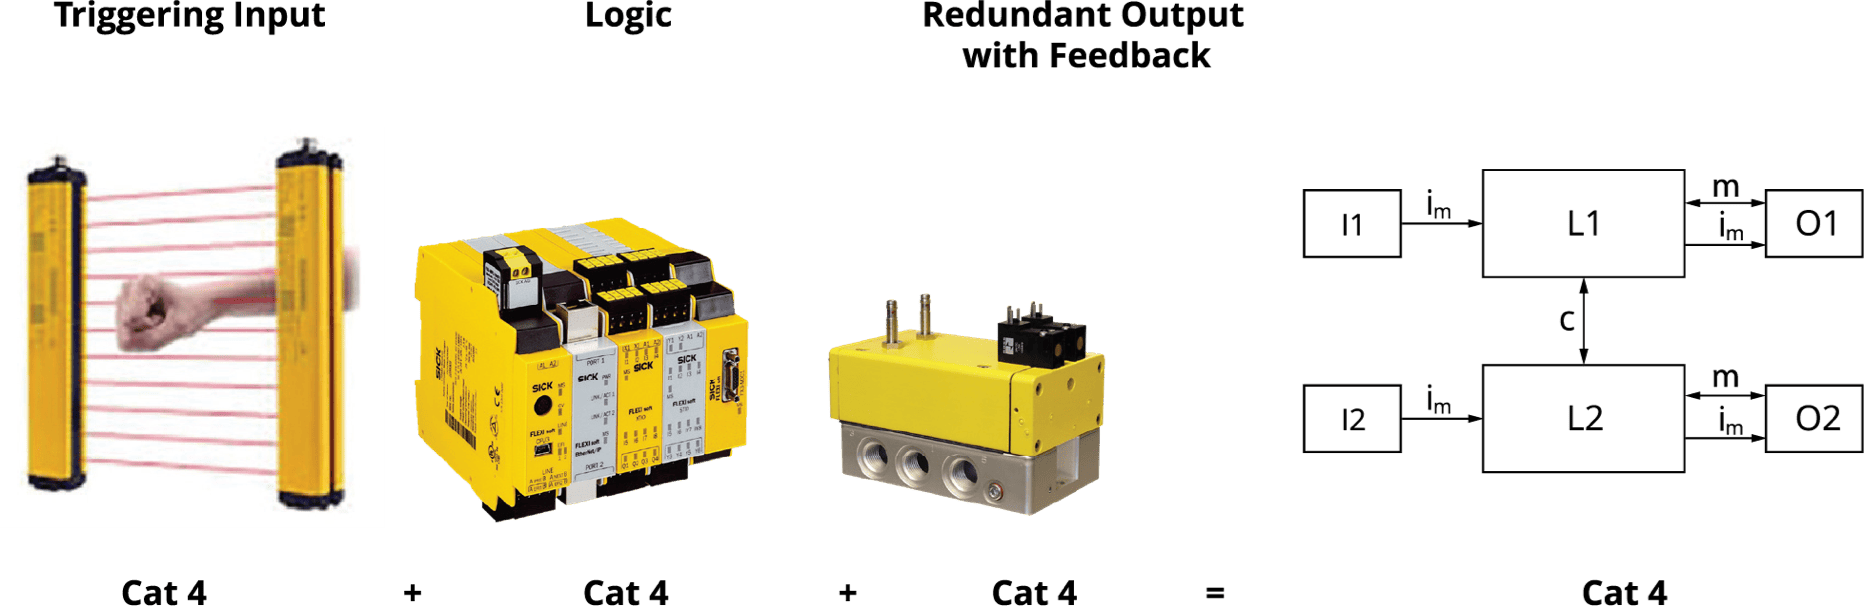
Reliability information on each part of the safety function needs to be collected. For this example, the safety function example below will be used to show how to collect and convert manufacturer reliability data into information that can be used to calculate system reliability.
- The Performance Level required (PL r) is Performance Level d (PL d)
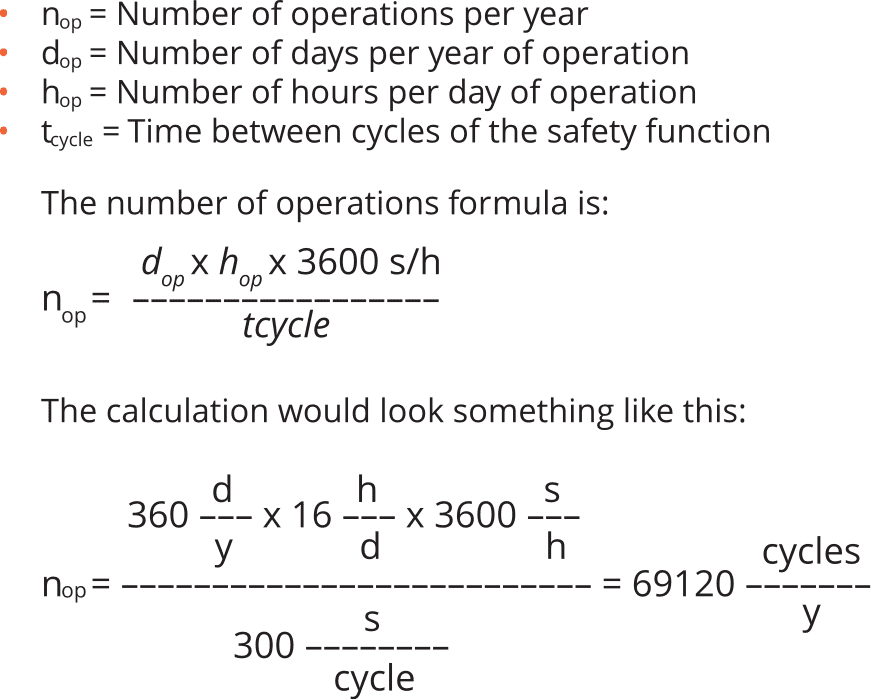
- The machine has a cycle time of 2 parts per minute, or 30 seconds
- The machine operates 360 working days per year at 16 working hours per day
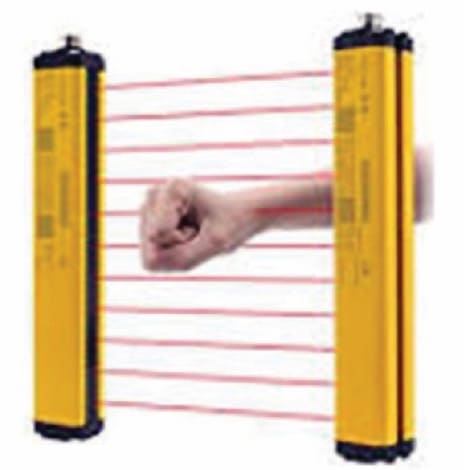
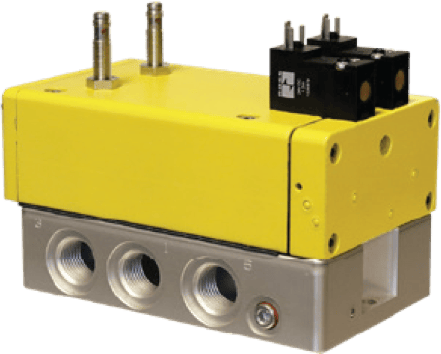
Reliability Information Example for Input Devices
| Input Device Reliability | |
|---|---|
| Type | Type 4 (IEC 61496-1) |
| Safety Integrity Level | SIL 3 (IEC 61508) SIL CL3 (IEC 62061) |
| Category | Category 4 (EN ISO 13849) |
| Performance Level | PL e (EN ISO 13849) |
| PFHD (mean probability of a dangerous failure per hour) |
15 * 10⁻⁹ (EN ISO 13849) |
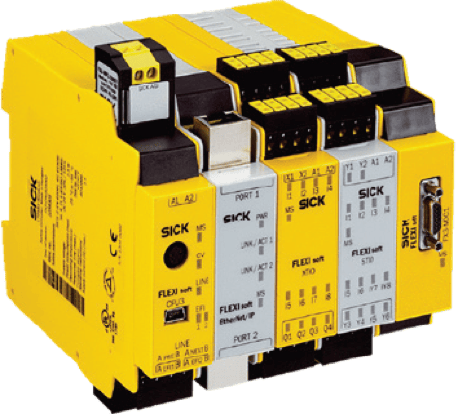
Reliability Information Example for Logic Devices
| Logic Device Reliability | |
|---|---|
| Standards | EN 954-1, ISO 13849-1, IEC/EN 6024-1, IEC 60947-4-1, IEC 00947-5-1, ANSI B11.19, AS 4024, 1 |
| Safety Classification | Category 4 per EN 954-1 (ISO 13849-1), SIL CL3 per EN IEC62061, PL e per ISO 13849-1 |
| Functional Safety Data | MTTFD > 398 Years Suitable for performance levels PL e (according to ISO 13849-1:2006) and for use in SIL 3 systems (according to IEC 62061) depending on the architecture and application characteristics |
| Certifications | CE Marked for all applicable directives, cULus and DGUV |
Reliability Information Example for Logic Devices
| Output Device Reliability | |
|---|---|
| Safety Classification | Max Category 4, PL e, SIL 3 |
| B10D Value | 20 million cycles |
| Monitoring | Dynamic, cyclical, external with customer supplied equipment. Monitoring should check state of both valve position sensors with any and all changes in state of valve control signals. |
| Diagnostic Coverage (DC) | High, 99% |
| Certifications | CE Marked for all applicable directives, cULus and DGUV |
Calculating Number of Operations (nop)
The first step of calculating the MTTFD of a system is determining the Number of Operations (nop) per year of the safety function.
This is done by collecting the following information:
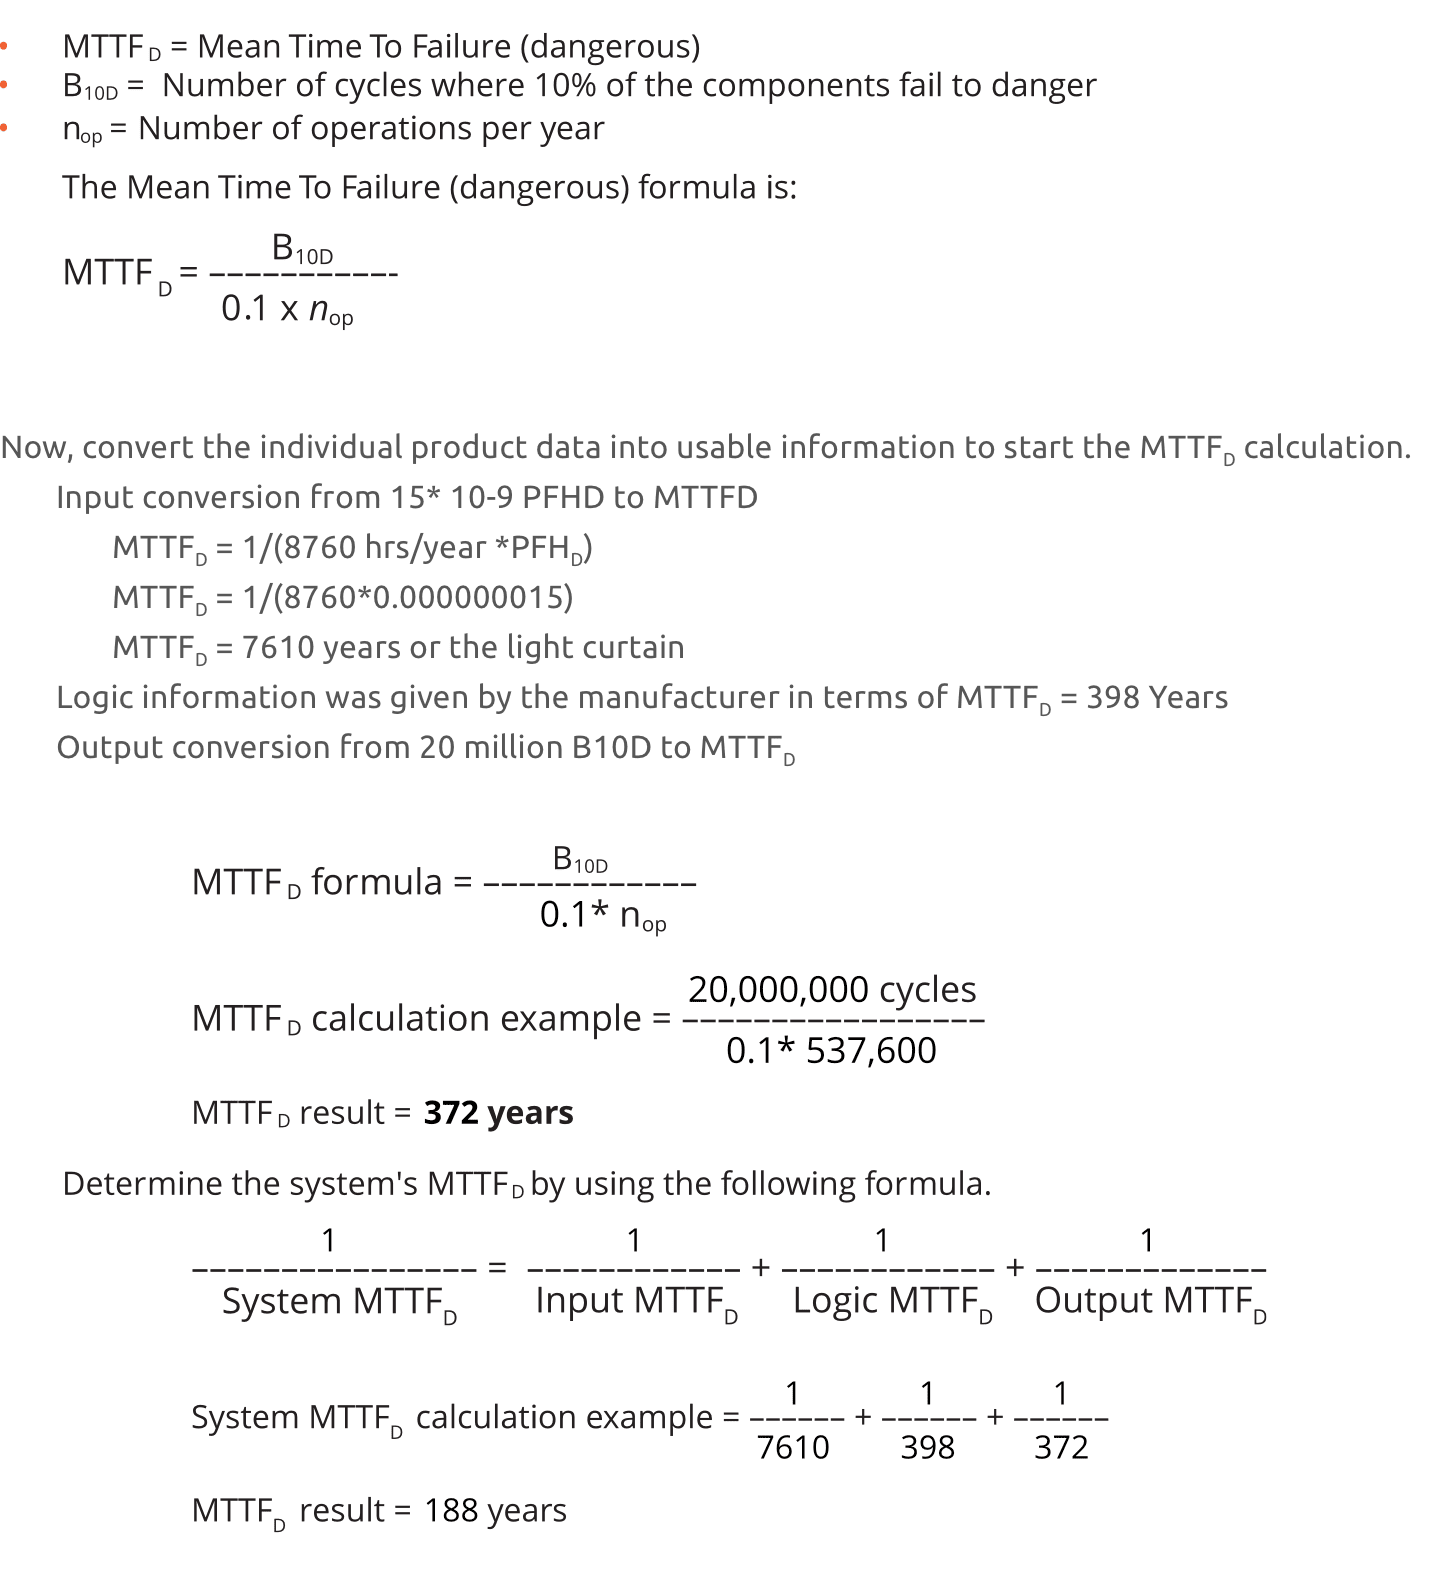
Calculating MTTFD
The second step of calculating the MTTFD of a safety system uses the calculated nop and reliability of each component in the safety function to determine system reliability. Component reliability reporting varies from manufacturer to manufacturer and from device type to device type.
This is done by collecting the following information:
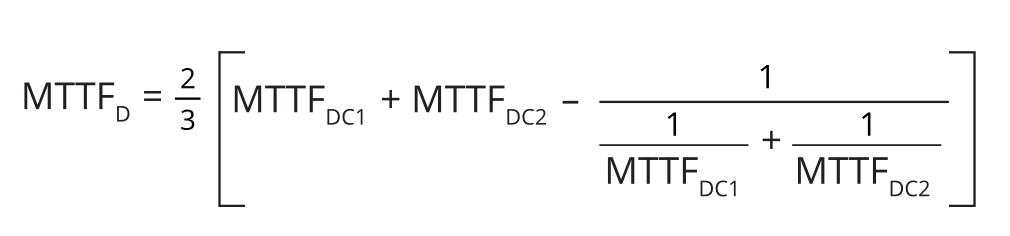
If the input, logic, and output devices are dual channel devices, or if the same input, logic, and output devices are used on both channels, the calculation is complete. If channel 1 and channel 2 use different devices, an additional symmetrisation calculation must be performed. See example below.
For the example, the result is HIGH reliability because the calculation resulted in an MTTFD of 188 years.
| Denotation of MTTFD | Level of MTTFD |
|---|---|
| Low | 3 years ≤ MTTFD < 10 years |
| Medium | 10 years ≤ MTTFD < 30 years |
| High | 30 years ≤ MTTFD < 100 years |
| MTTFD of the system = 188 years = HIGH | |
Calculating Diagnostic Coverage (DC)
- Number of Operations per year (Nop) = 69120 cycles per year
- Input device MTTFD = 7610 years
- Logic device MTTFD = 398 years
- Output device MTTFD = 372 years
- The monitoring capability of the input device = 99%
- The monitoring capability of the logic device = 99%
- The monitoring capability of the output device = 99%
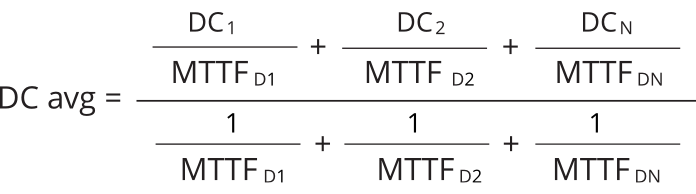
The MTTFD data that was calculated earlier is used along with the DC data from Table E.1 to determine the overall system DC.
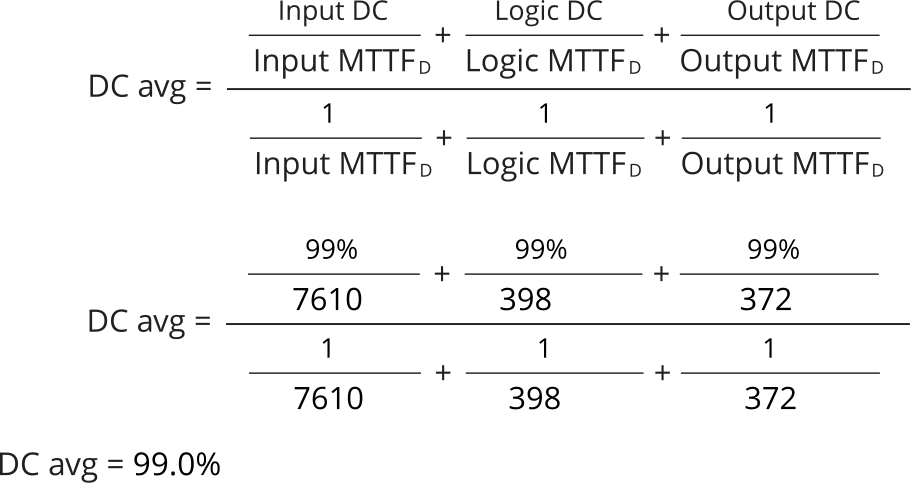
Since the overall system diagnostic coverage is 99%, the system has a DC range of High.
Determining Common Cause Failures Score
Common Cause Failures (CCF) can be avoided through the use of good engineering practises. The CCF scoring table can be found in table F.1 of ISO 13849-1.
| No. | Measure against CCF | Score | |
|---|---|---|---|
| 1 | Separation / Segregation | 15 | |
| 2 | Diversity | 0 | |
| 3 | Design / Application / Experience | 20 | |
| 4 | Assessment / Analysis | 5 | |
| 5 | Competence / Training | 5 | |
| 6 | Environmental | 35 | |
| Total | 80 | ||
ISO 13849-1 requires the designer to achieve a CCF score of 65 or higher to prove that they have used good engineering and design practises to reduce the effect of systematic failures. The example here achieves a score of 80 because of the selected design and components.
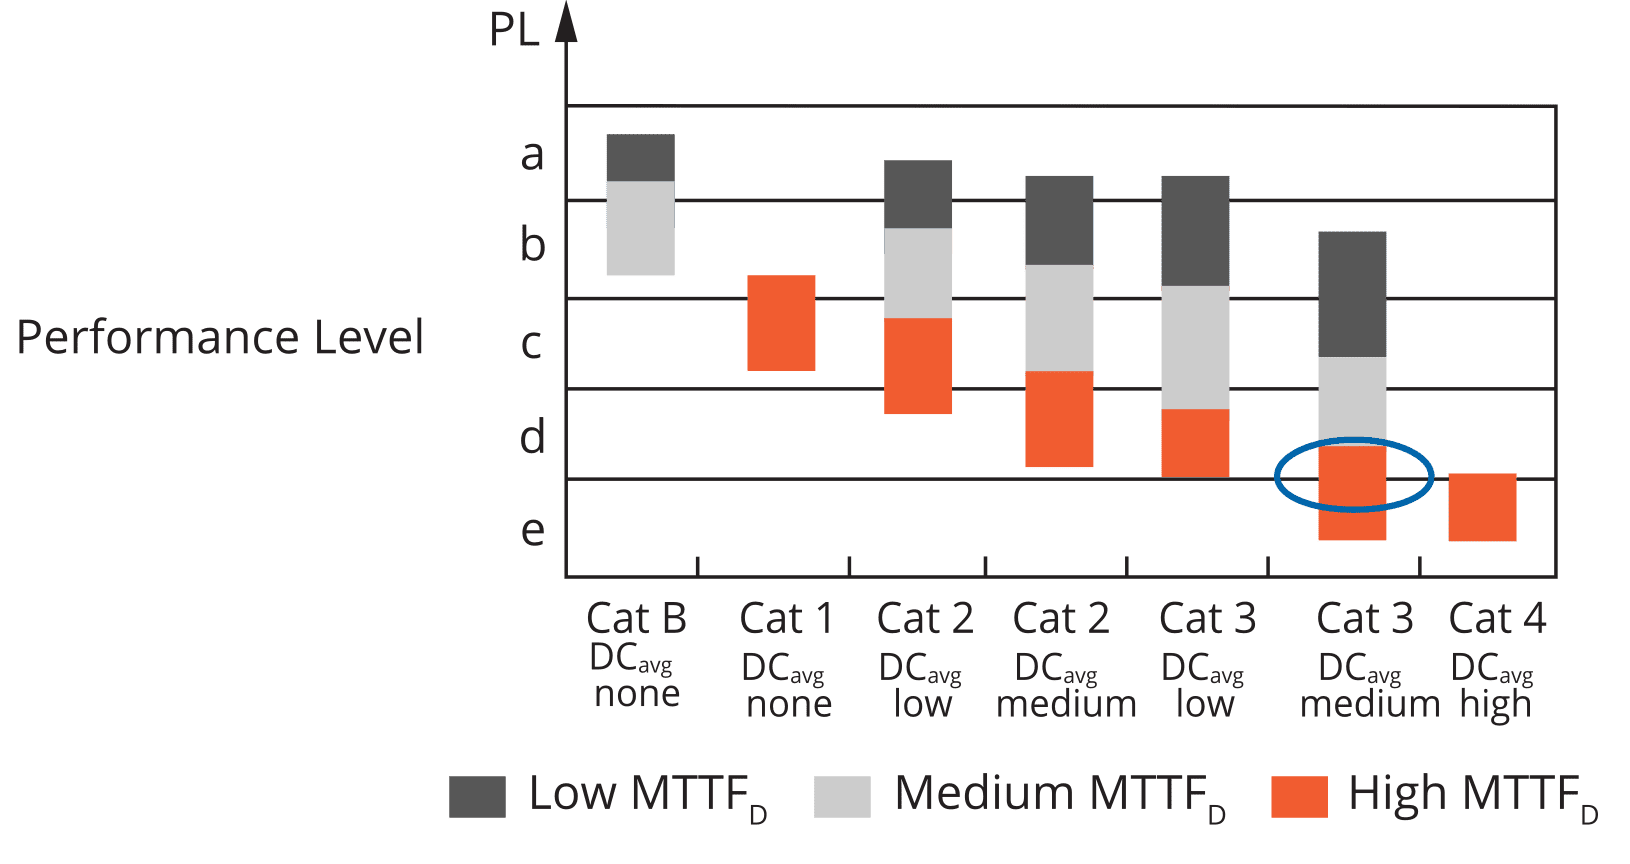
Performance Level
The last step of the design verification process uses the calculated MTTFD, calculated DC, and selected structure to determine if the Performance Level Achieved (PLa) meets or exceeds the Performance Level Required (PLr). In the example circuit, MTTFD is High, DC is 99%, and structure is Category 4. Therefore, the achieved performance level is e, which exceeds the required Performance Level of d (from above).
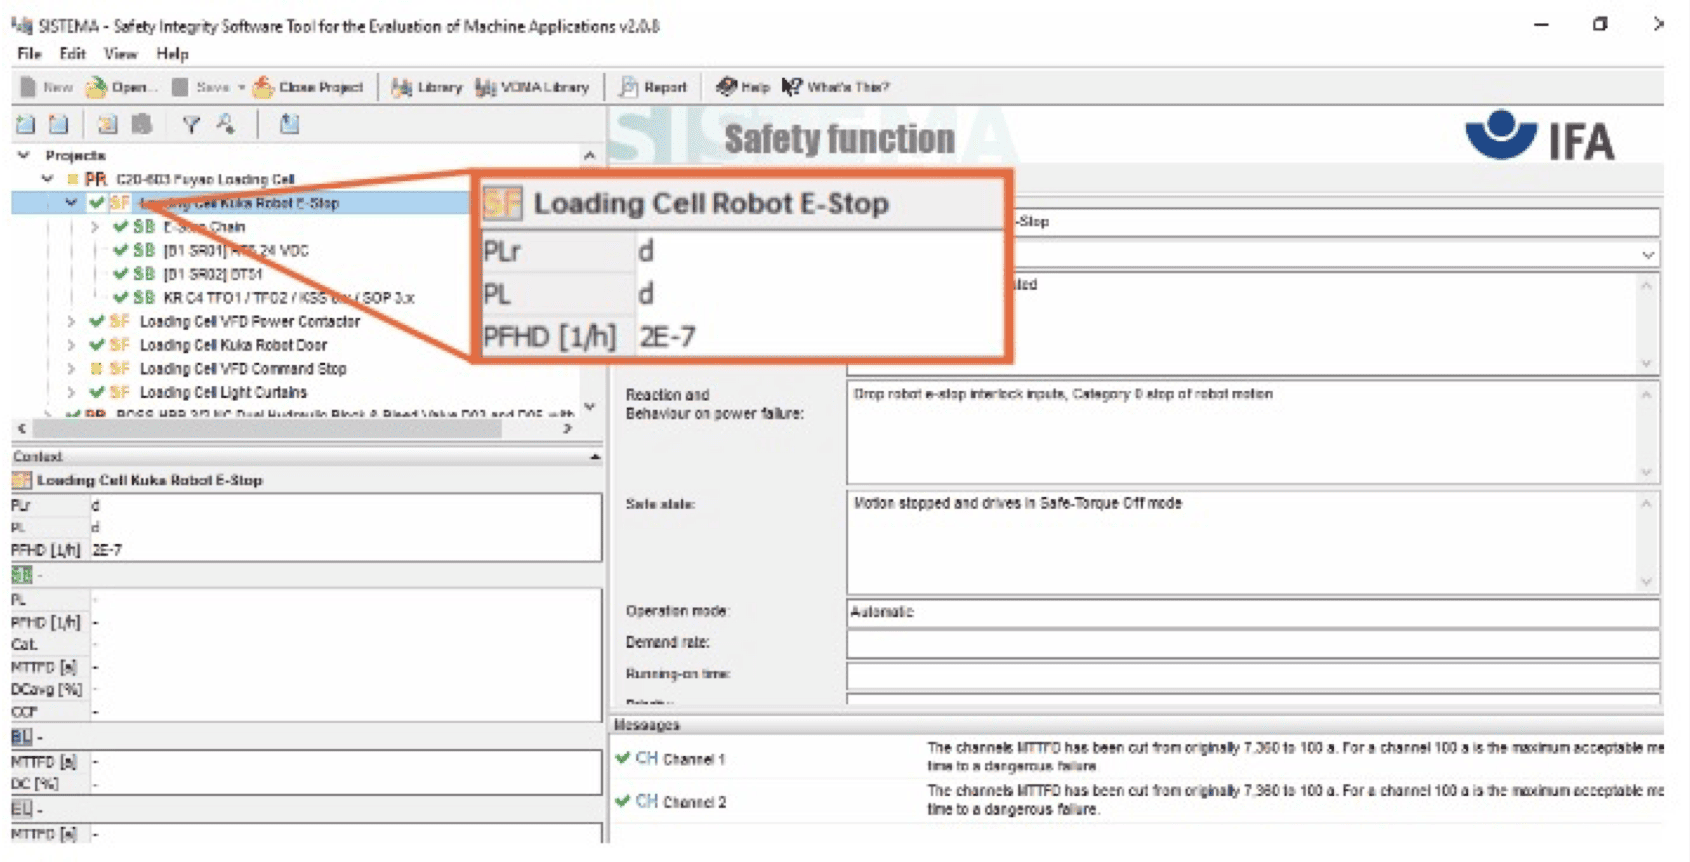
SISTEMA Software
The previous calculations can be cumbersome to perform and difficult to document. The DGUV in Germany publishes the SISTEMA “Safety Integrity Software Tool for the Evaluation of Machine Applications”, which is free software that allows you to create devices and safety functions to verify the PL of the system. The user models the structure based on design architecture and populates the MTTFD or B10D values, DC, and CCF data. Many manufacturers publish SISTEMA data libraries with all pertinent data for their products that can be loaded into the safety function. You can download the ROSS SISTEMA library below.
Get StartedThis is an example of a SISTEMA report that shows the Performance Level that can be achieved using certain selected products.
The SISTEMA software uses the product manufacturer’s data through the use of imported libraries.